Know what the year costs before it happens.
Comp is usually the biggest line in the sales budget and the last one anyone can forecast. Incentives.guru runs the forecast on the same engine that pays reps, so the number you plan to is the number that gets paid.
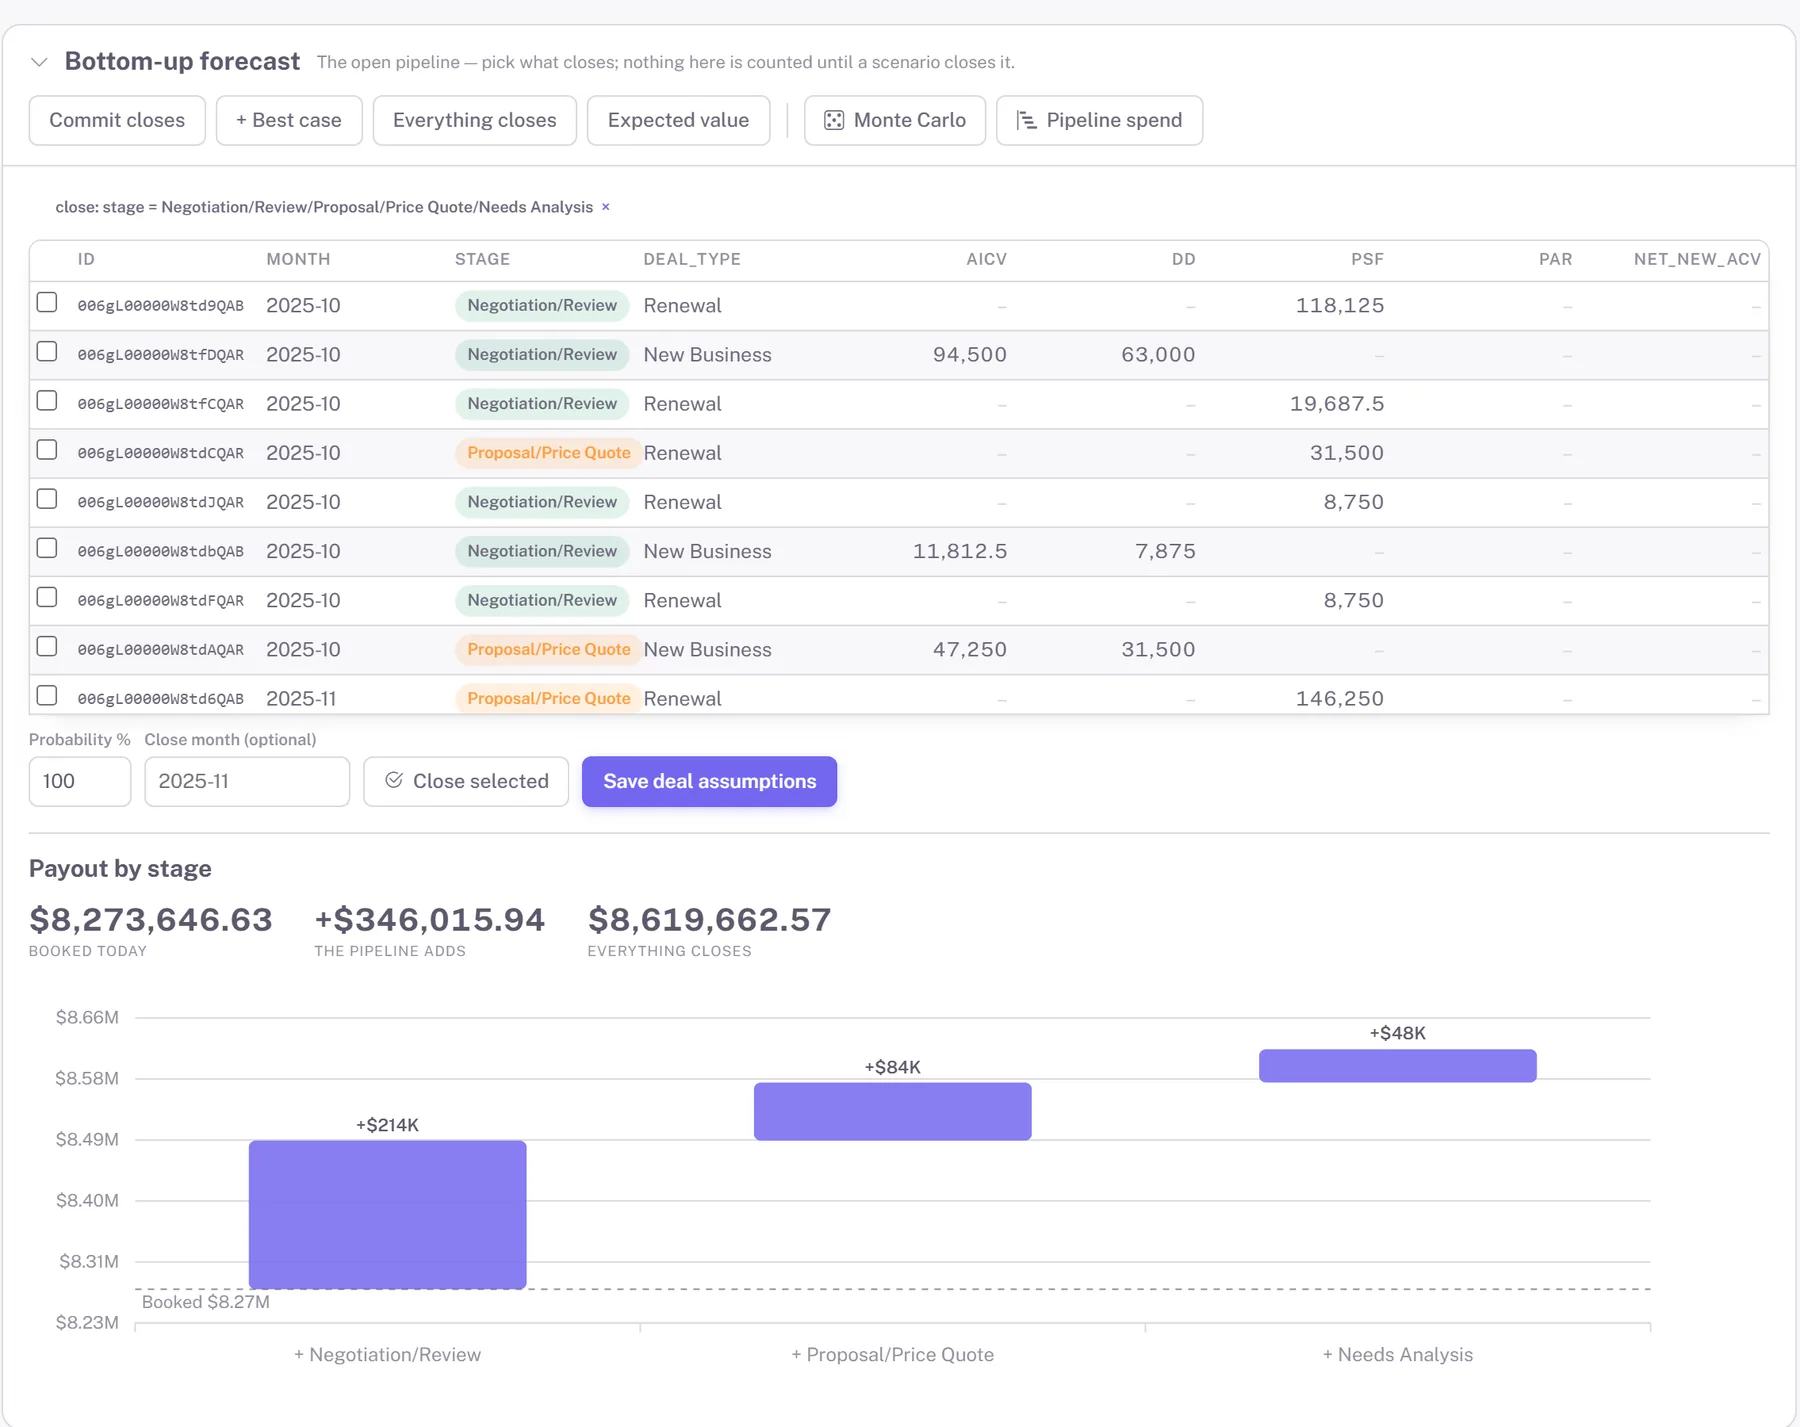
Pick what closes. See what it pays.
The open pipeline, straight from Salesforce, with the payout each stage adds on top of what is booked today. Close, slip or drop deals with a probability and a month, or use the one-click views: commit, best case, everything closes, expected value.
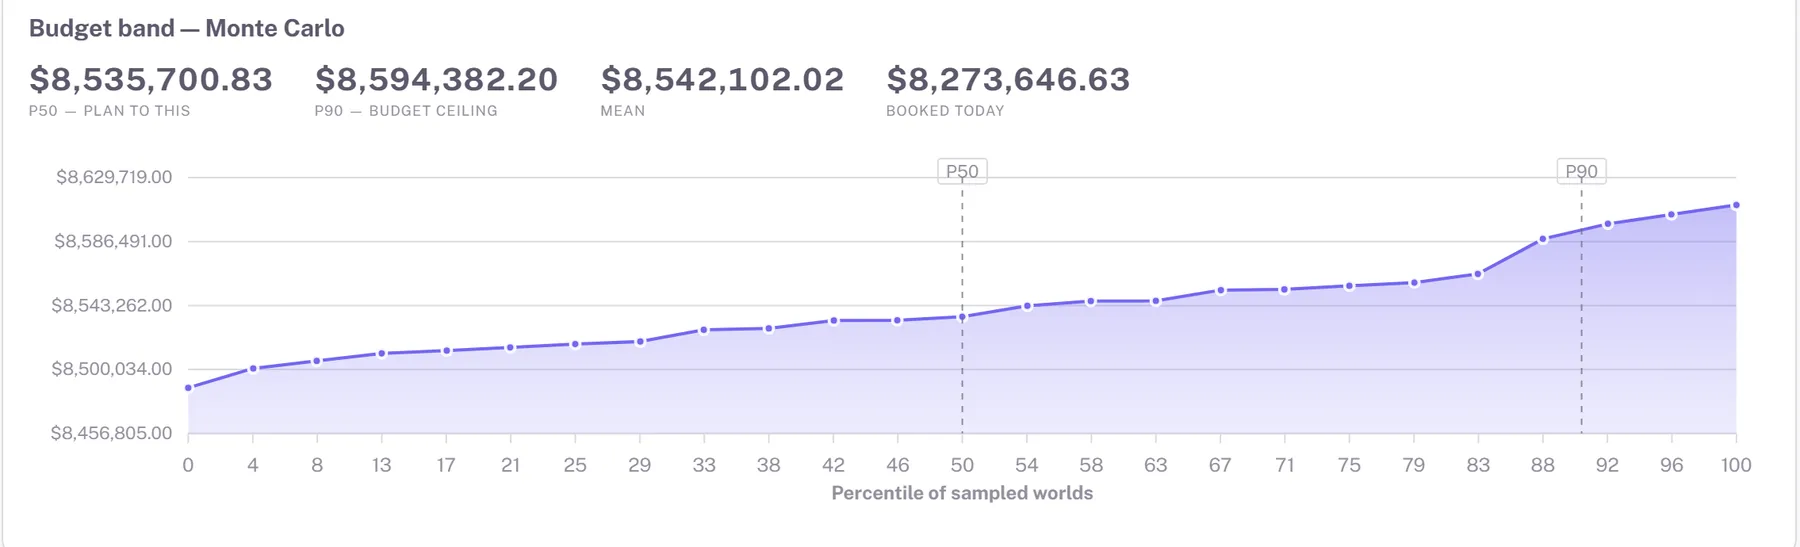
A P50 to plan to and a P90 to cap the budget.
Monte Carlo mode samples which pipeline deals close at their stage probabilities and prices the whole year for each sampled world. You get a distribution, not a point estimate: plan to the P50, set the accrual ceiling at the P90.
- ✓ Every sampled world is a full engine run, not a spreadsheet multiplier
- ✓ Stage probabilities come from your own CRM data
- ✓ Pair it with a top-down "finish at 115%" projection in the same scenario
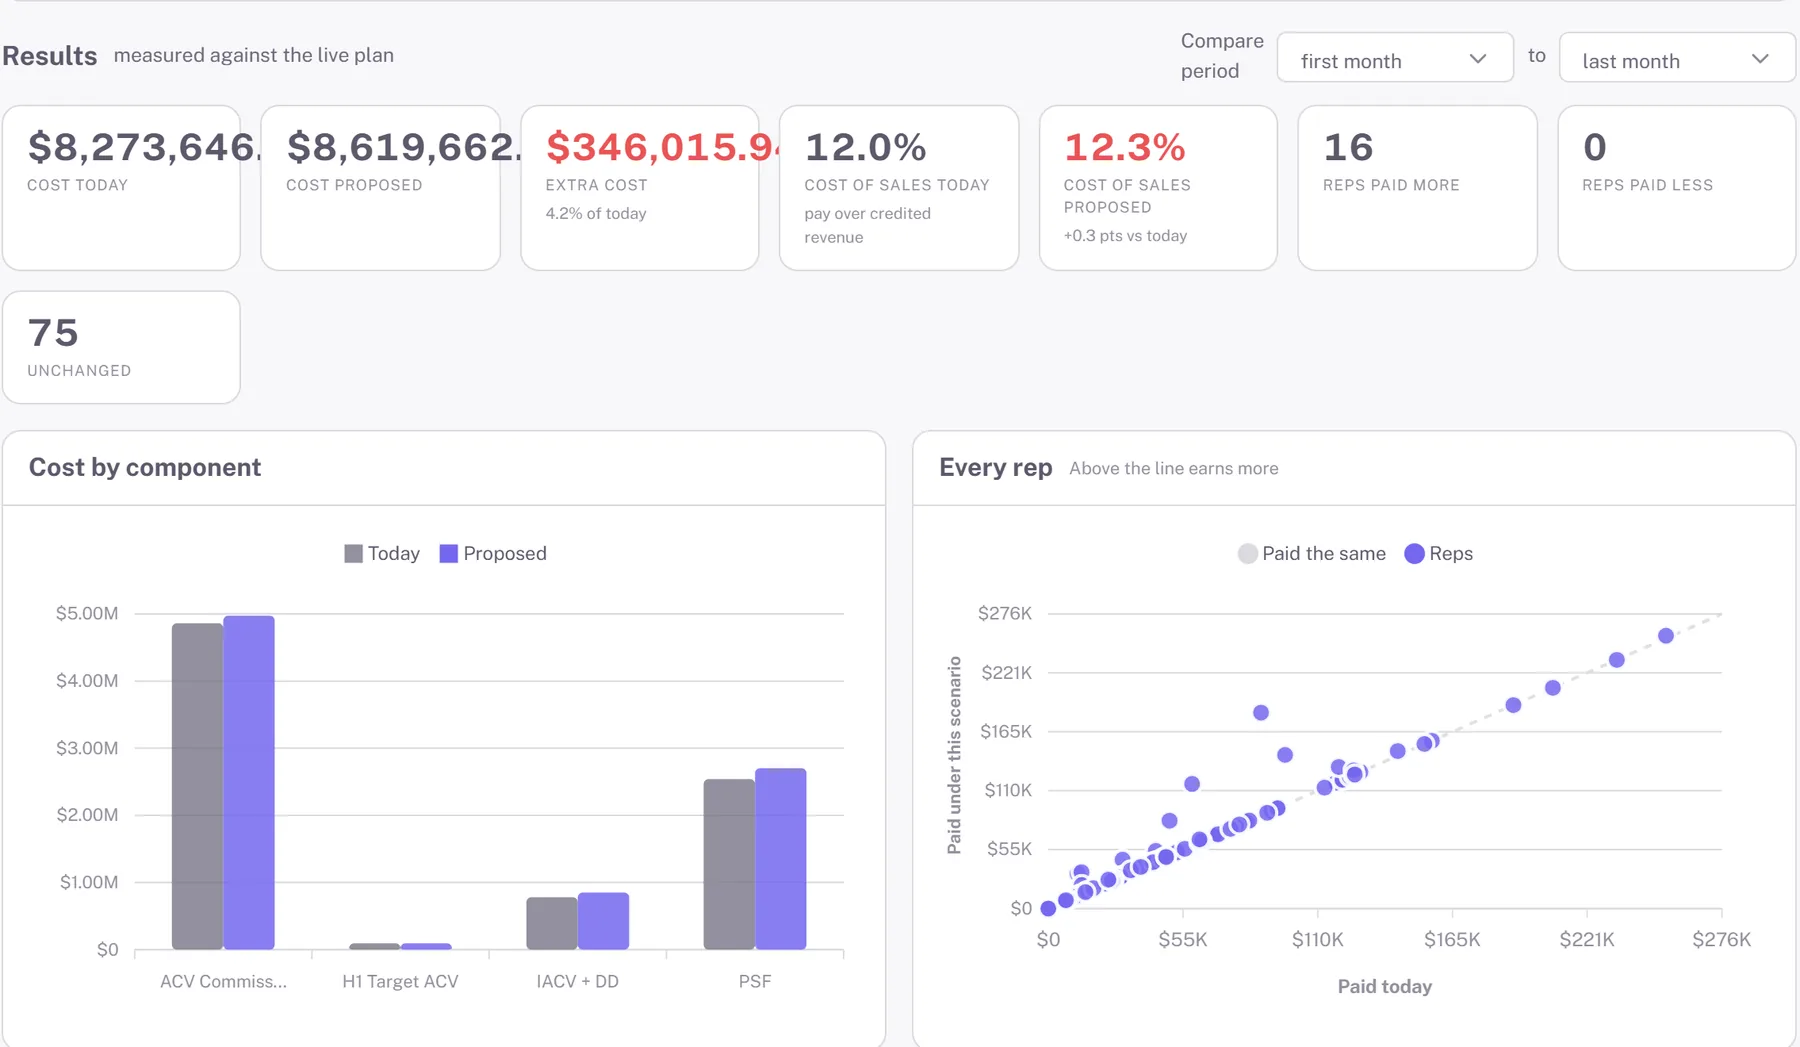
Every scenario reports what it does to cost of sales.
Extra cost, cost of sales today versus proposed, reps paid more, reps paid less, and the per-rep scatter that shows who moves. The denominator is booked revenue counted once per deal, so a growth assumption cannot flatter the ratio.
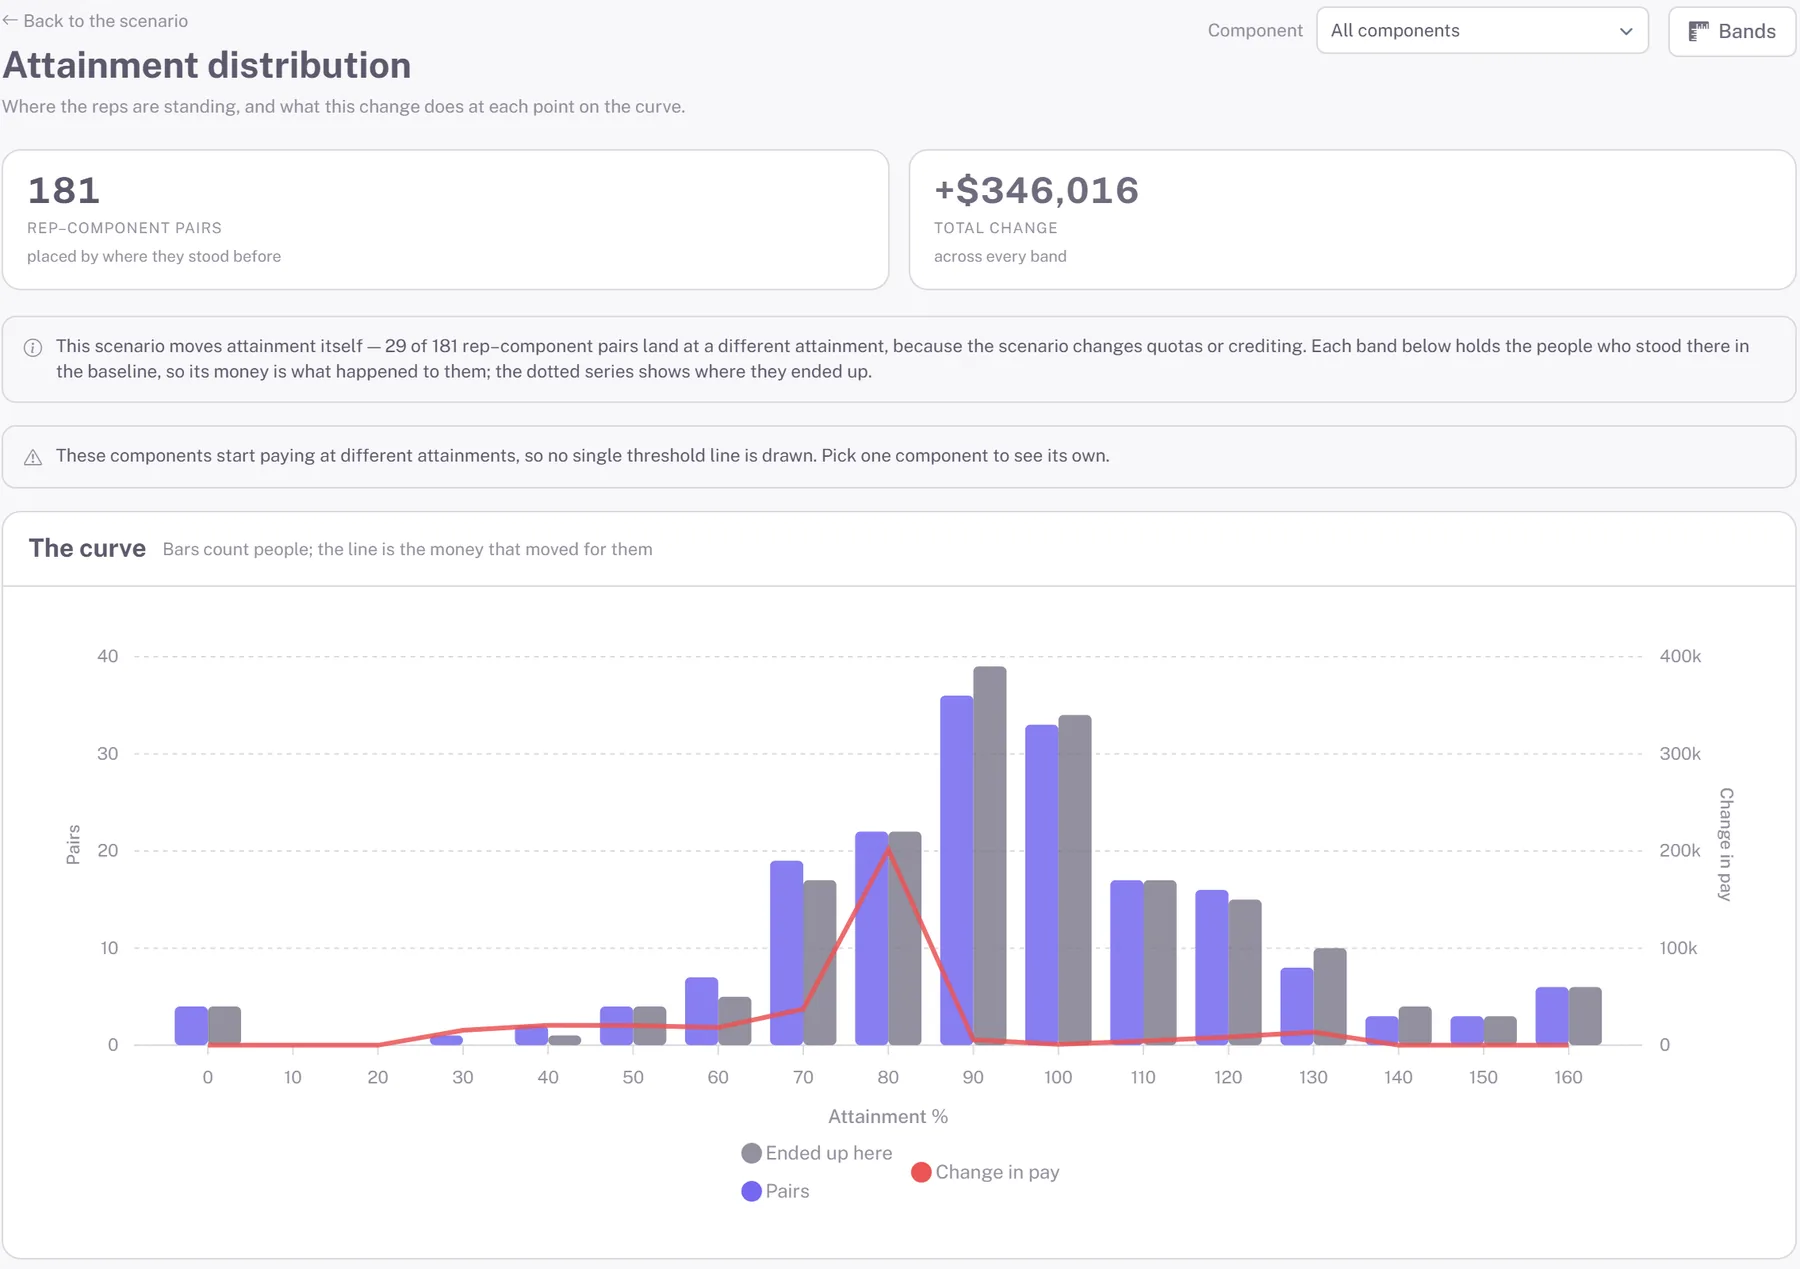
See the curve before you change it.
Every scenario forks the entire data set into an isolated copy in well under a second, runs on it, and leaves production untouched. Then it shows you where the money moved on the attainment curve, band by band, so a cliff at 80% is visible before a rep finds it.
- ✓ Rate tables, quotas, kickers, crediting and roster changes, all as scenarios
- ✓ Growth assumptions and roster moves compound in one run
- ✓ Promote the winner to production when the numbers hold
Forecast and payroll are the same calculation.
One engine
The forecast is not a model of the plan. It is the plan, run on different inputs. No reconciliation between what finance modeled and what comp ops paid.
Every dollar traces
Click any number back to the deals, crediting rules and rate table that produced it. Auditors like it. So do reps.
Reproducible to the cent
A full re-run of the demo book reproduces its baseline exactly. Same inputs, same output, every time.
Bring a plan and a pipeline. Leave with a forecast.
A thirty-minute demo on your numbers, not ours.
Book a demo