Changing the plan without breaking payroll.
A plan change on the demo book, from the committee's question to a versioned promotion: modeled on a fork, priced by the engine that pays, compared with an alternative, and put into production from the month you choose. Every screen is the live demo as it stands, and the whole thing fits in an afternoon.
- Step 1 · The comp committee
- Step 2 · The scenario
- Step 3 · The answer
- Step 4 · The curve
- Step 5 · A second option
- Step 6 · Where it lands
- Step 7 · The logic itself
- Step 8 · The decision
- Step 9 · The shelf
The period side of the story, from the signed plan to the audit pack, is at One period, start to finish →
It starts as a question, not a ticket.
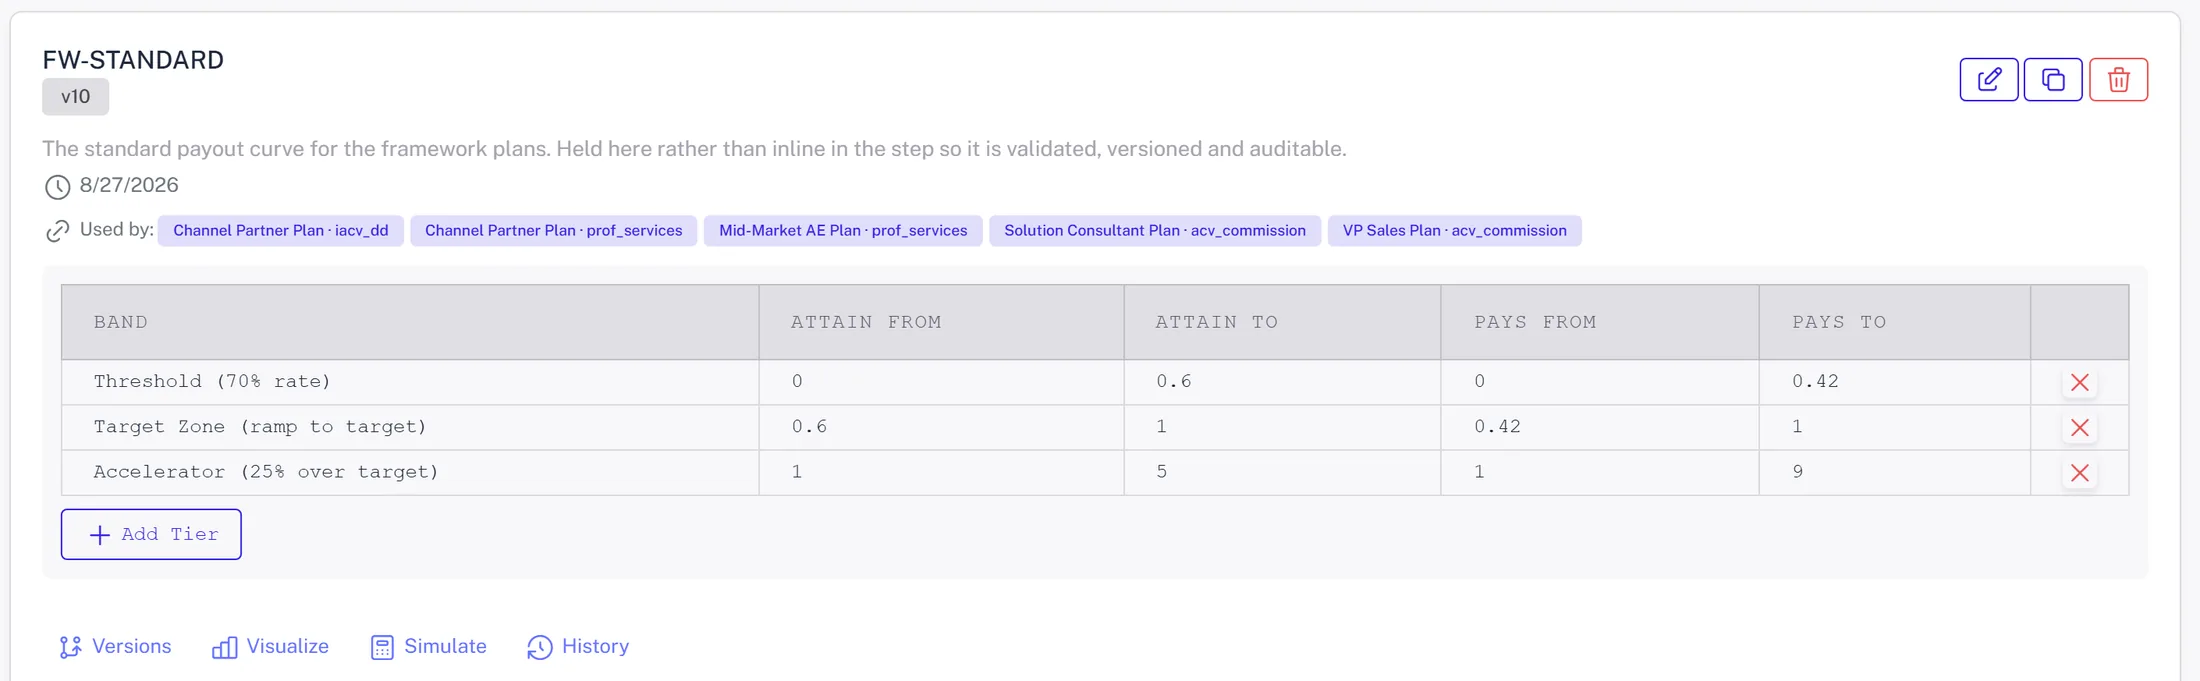
The committee wants the entry threshold at 70% instead of 60%. The admin asks the assistant what that would have cost this year. The assistant finds the one place the number lives, shows old and new, and offers to model it before anything changes.
- ✓ The change is one edit to the FW-STANDARD payout tiers
- ✓ Model first, or apply now behind a confirmation card
- ✓ Nothing writes to production from a question
One edit, on a fork of everything.
The scenario forks the whole data set and the plan logic into an isolated copy in well under a second, changes the one lever, and keeps a record of exactly what it changed. The live plan is never touched; the baseline it is measured against is the production run.
- ✓ What this scenario changes: the lever, what it was, what it becomes
- ✓ Data changes, growth, roster moves and forecasts can stack in the same scenario
- ✓ Branch the logic, branch the database, run the year

Priced, not estimated.
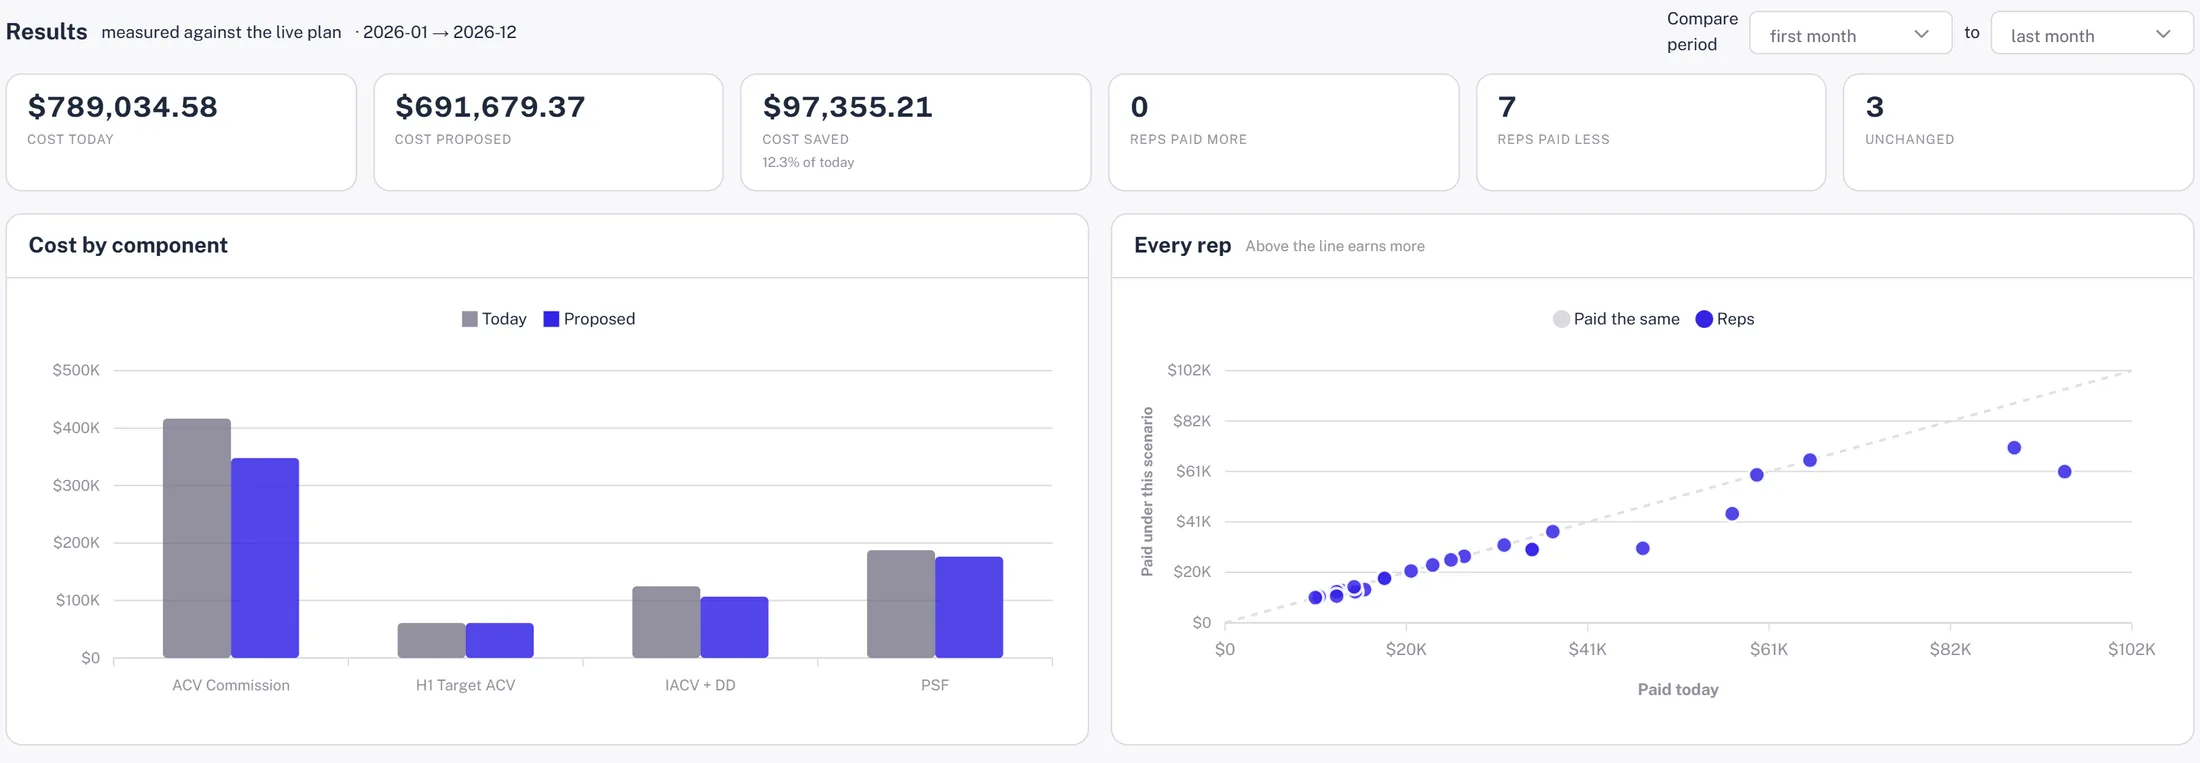
The scenario runs the same engine that pays reps, on the same year of deals. The result is cost today against cost proposed, who is paid more and who is paid less, and the cost by component, in about ten seconds.
- ✓ $789,035 today, $691,679 under the change: $97,355 saved
- ✓ Seven reps paid less, none paid more, three unchanged
- ✓ Every rep above or below the line is a click away
See the cliff before a rep finds it.
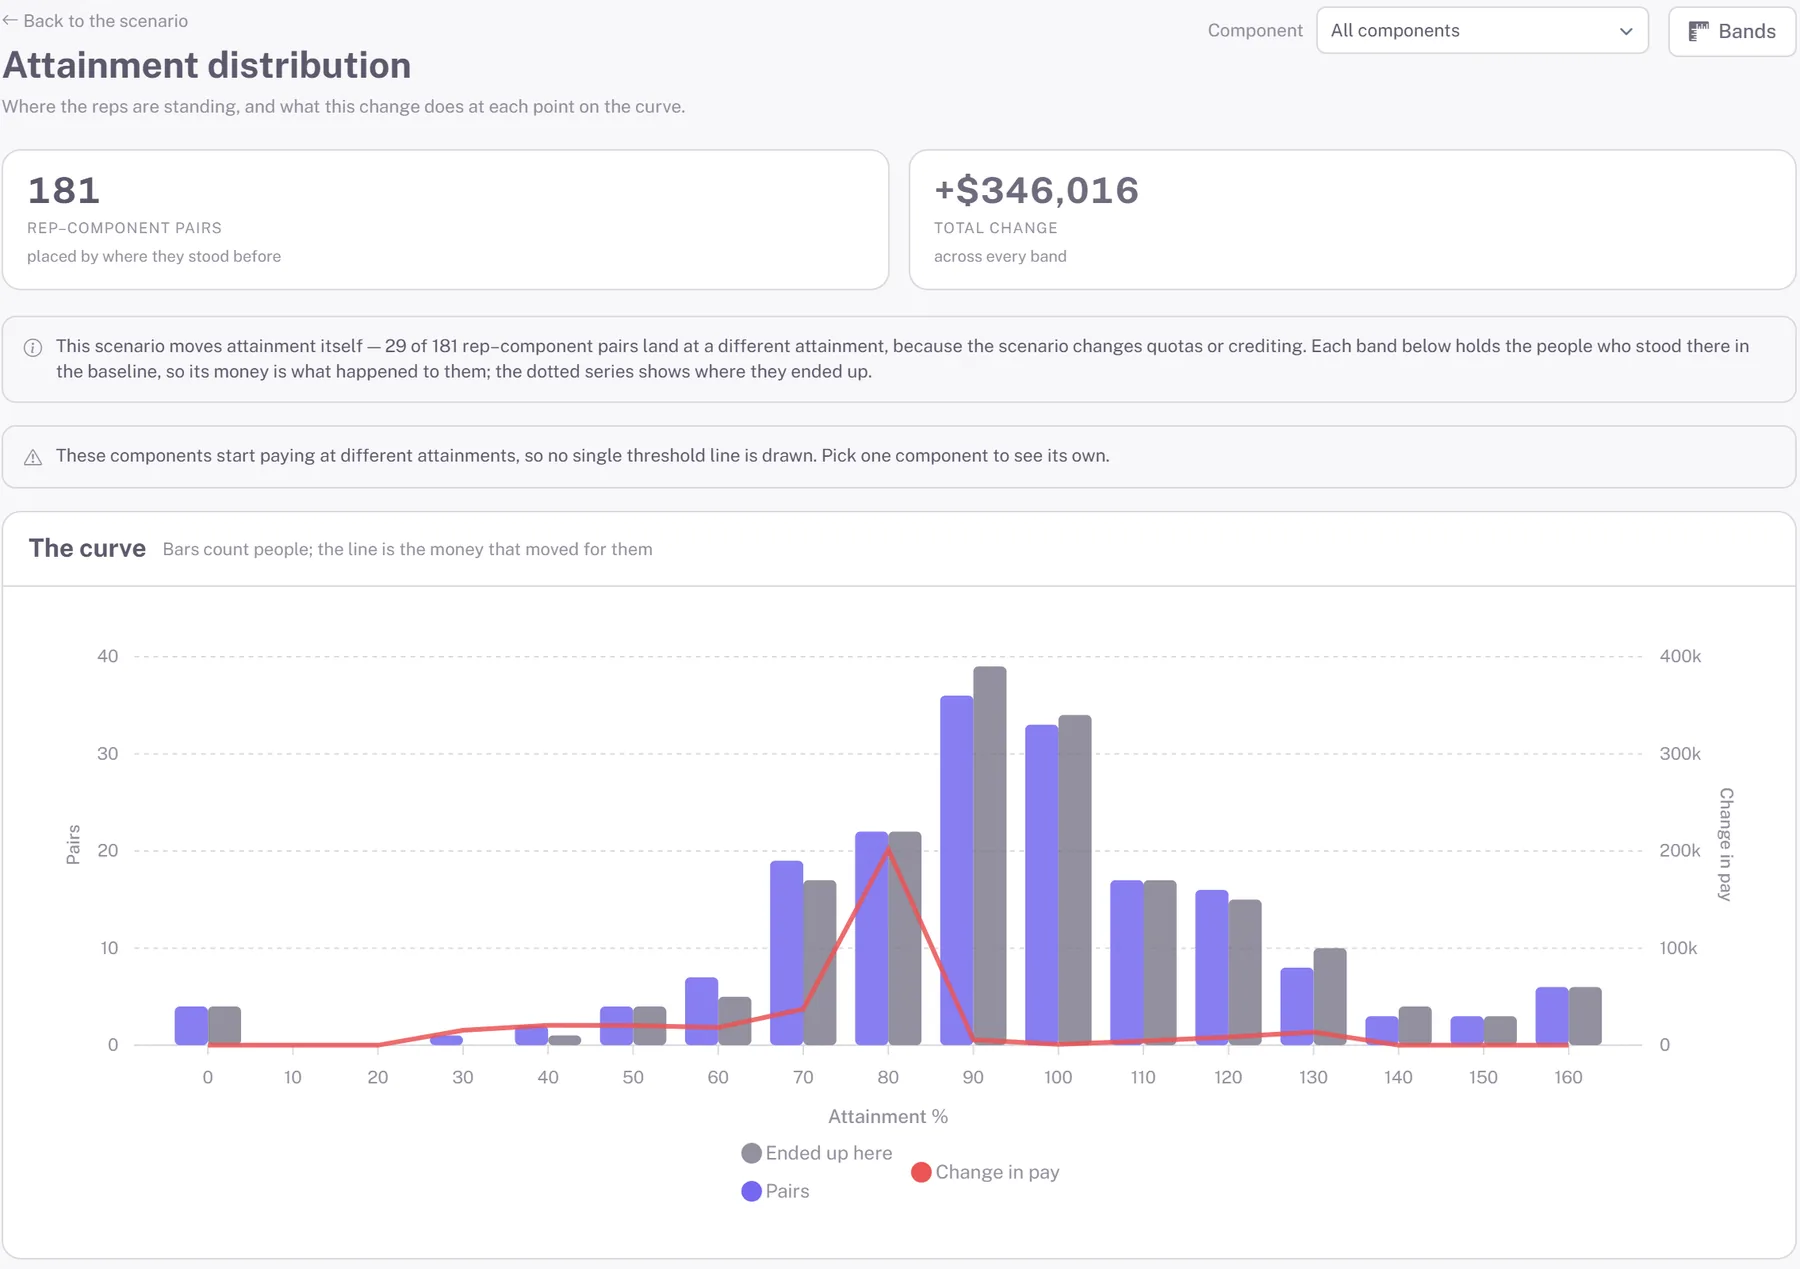
The attainment distribution puts every rep-component pair where it stood before the change and shows what the money did at each band. The hardest-hit band is 60 to 70%: the reps just under the new threshold. That is the conversation the committee needs to have before the plan ships.
- ✓ Bars count people, the line is the money that moved for them
- ✓ Pick one component to see its own threshold
- ✓ Band by band, from the last run, no extra runs needed
Compare it with something kinder.
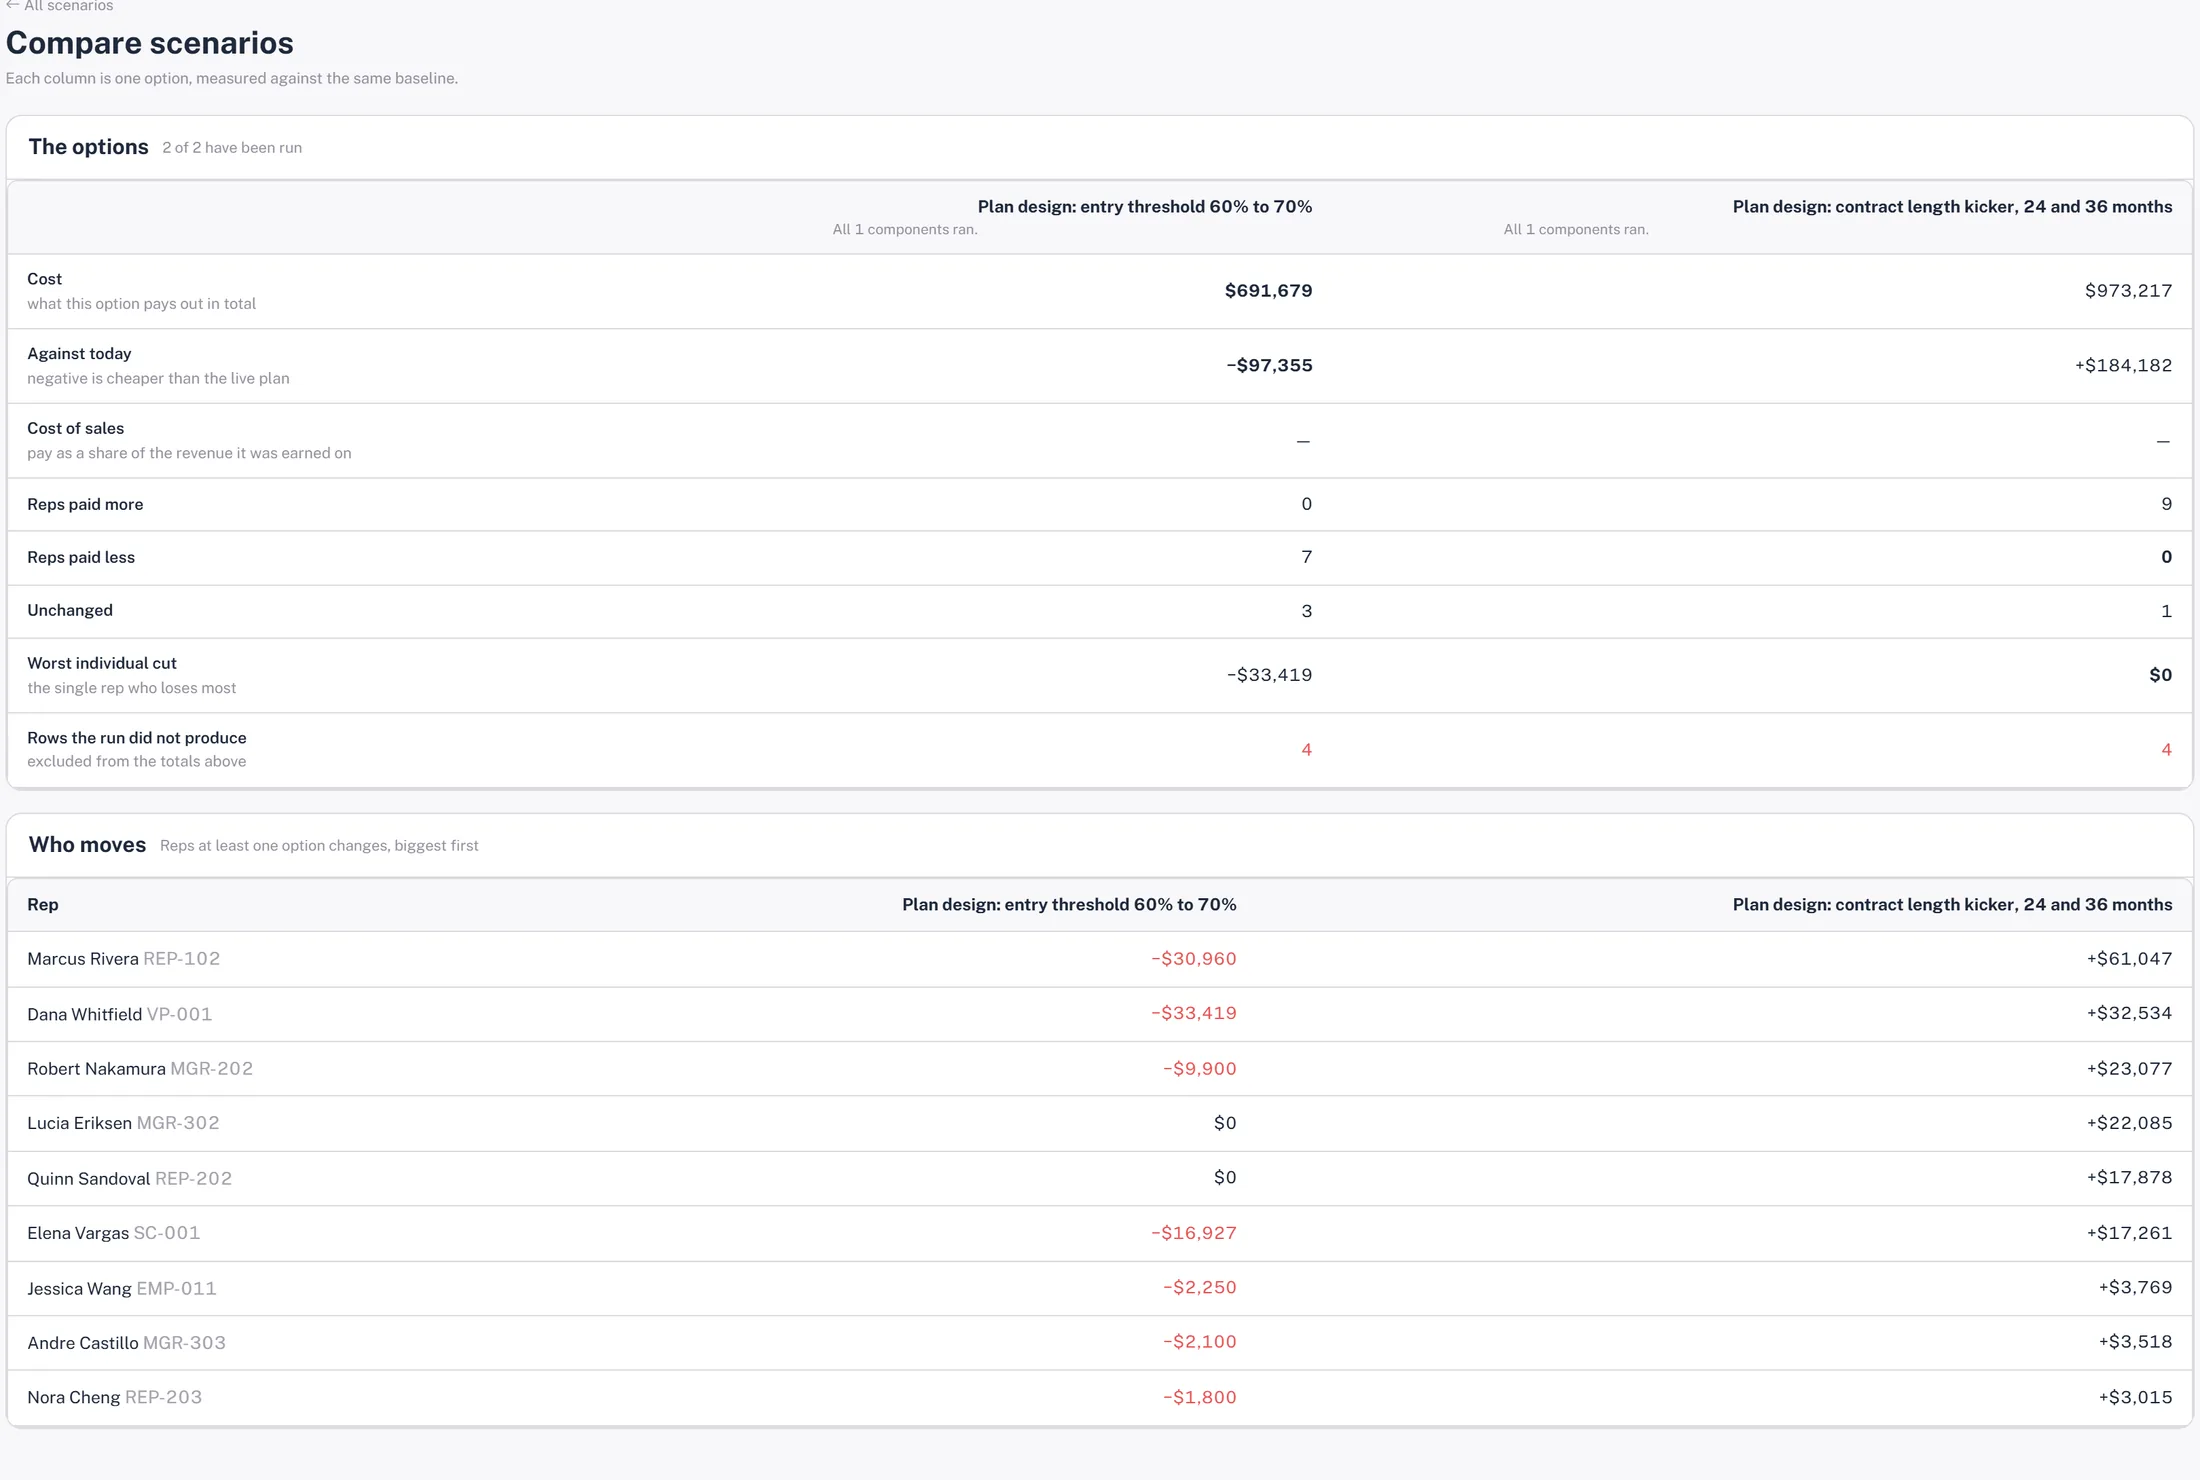
A contract-length kicker, 24 and 36 months, modeled the same way. Side by side against the same baseline: cost, against today, reps paid more and less, and the worst individual cut. One saves money and cuts seven reps; the other costs more and cuts nobody.
- ✓ Every column is one option measured against the same baseline
- ✓ Who moves, biggest first, under each option
- ✓ Export the whole scenario to Excel for the deck
The same money, grouped by the people it happens to.
By region, role, segment or tenure. A change that looks fair in total can land on one region or one cohort. Here US West carries the largest cut.
- ✓ Region, role, segment, tenure, one click each
- ✓ Today, scenario, and the change with its percentage
- ✓ Rep by rep underneath, with the explanation behind each line

One flow pays every plan. The curve lives outside it.
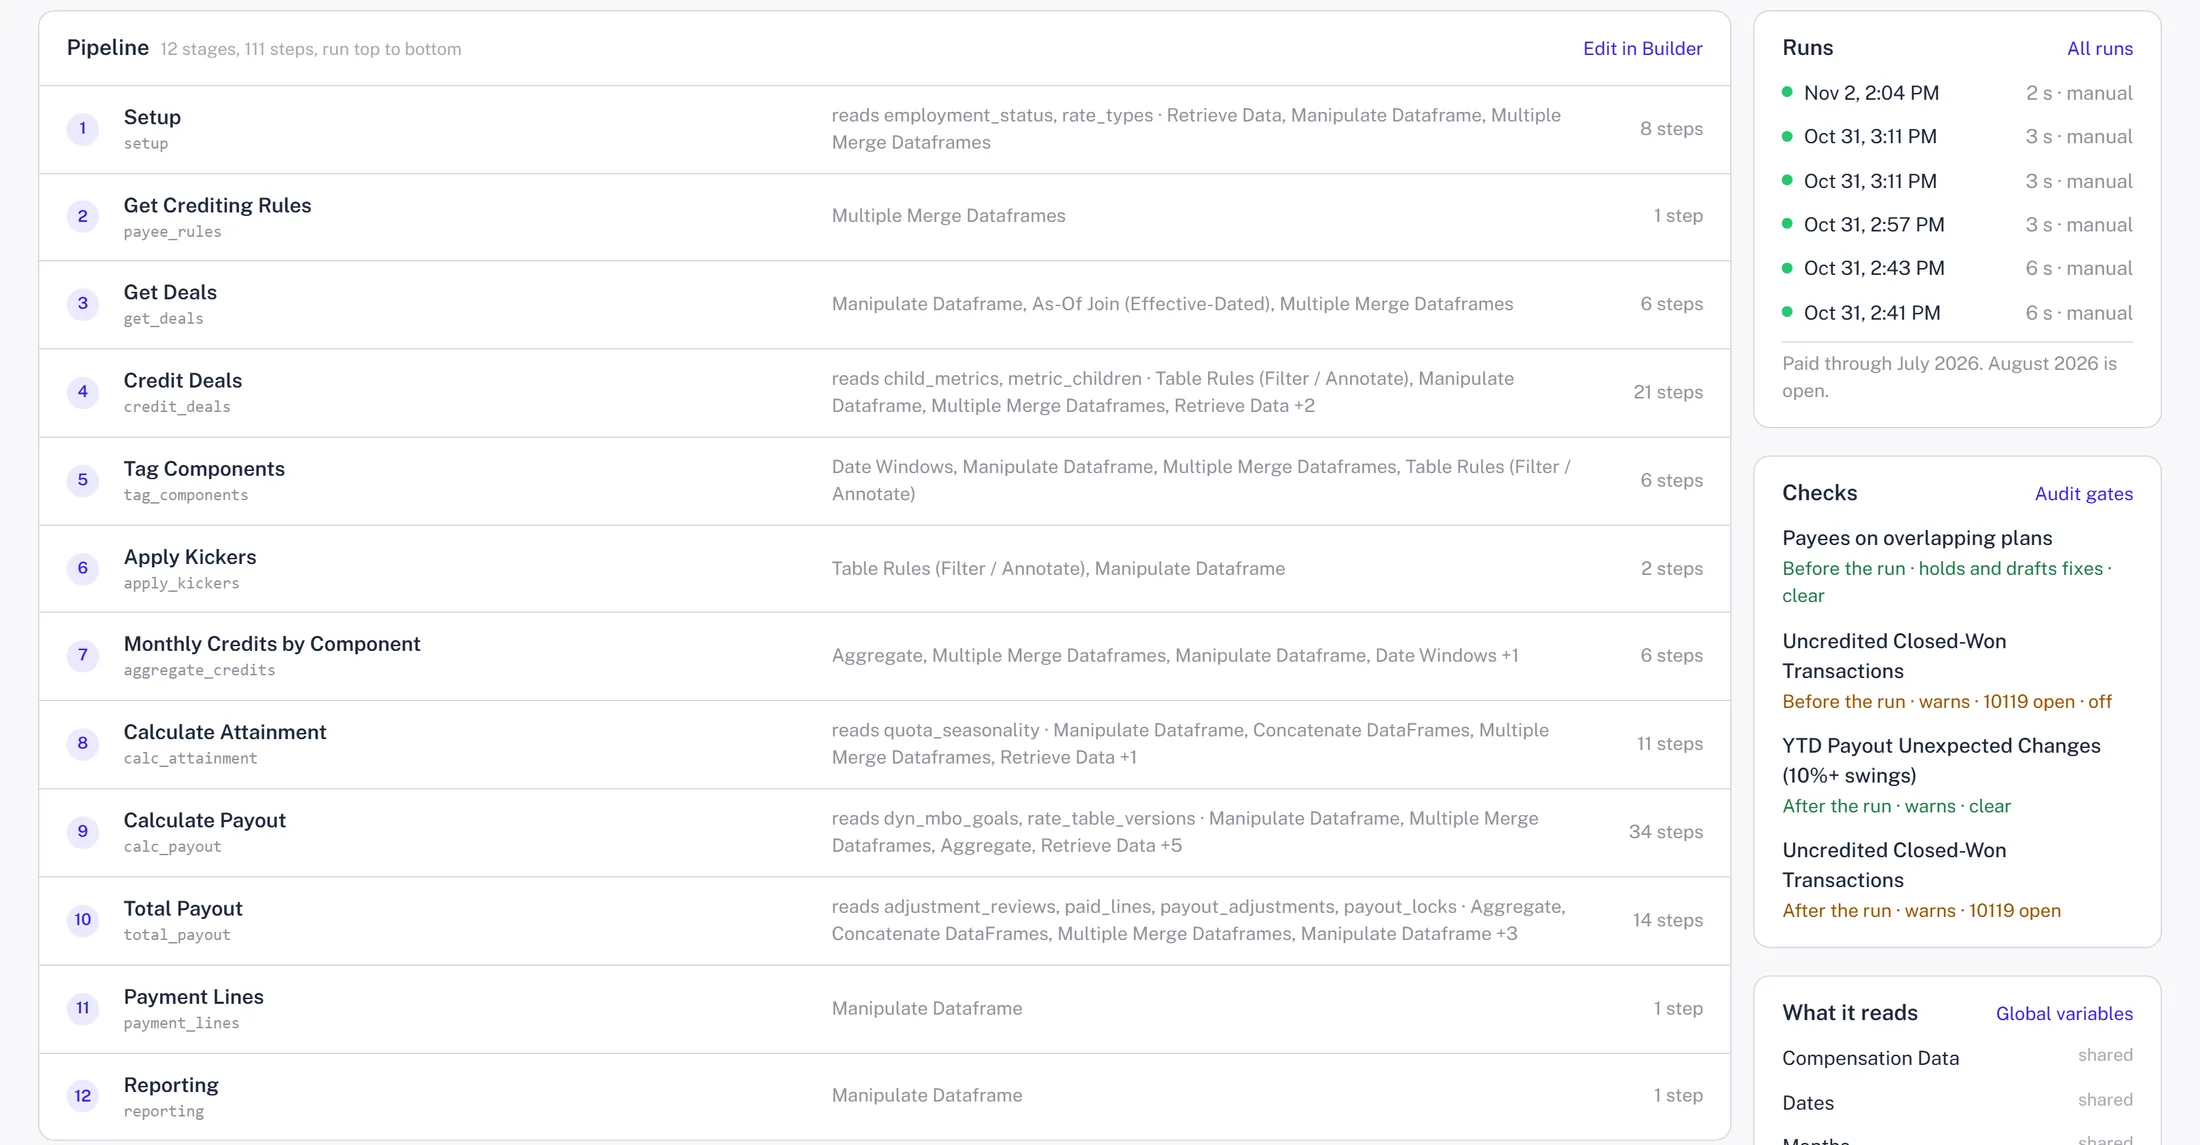
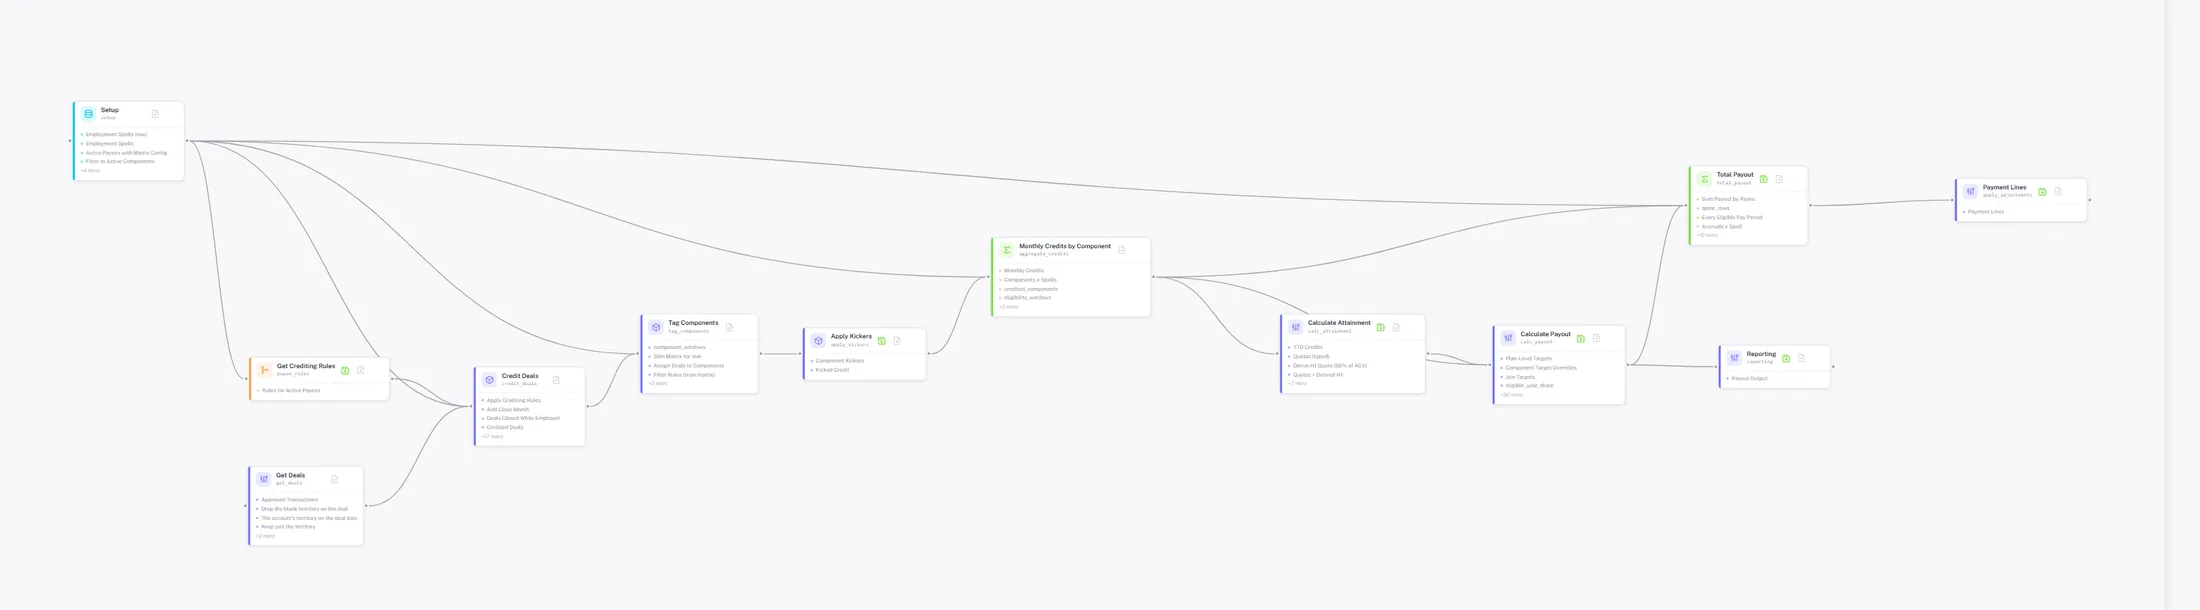
The Compensation Framework is twelve stages and 111 steps on a canvas, checked by four gates, paying six plans. The rate tables are held outside the steps so they are validated, versioned and auditable, and so a scenario can change a band without touching a step.
- ✓ Drag and drop steps, no formulas hidden in cells
- ✓ Every plan through one set of variables; the plan matrix decides who gets what
- ✓ Audits gate the run before and after
Promote it, and it pays from the month you chose.
Promote the winner from the scenario page. The rate table gets a new version effective from the chosen month, so earlier months keep paying on the old bands and the change never rewrites history. The promotion lands in the audit trail with who and when, and the next run's diff shows exactly who moved.
- ✓ Rate tables versioned by effective date, as-of joined by month
- ✓ What changed between runs, payee by component
- ✓ The audit pack checks plan logic changes and rate versions in effect every period
Twelve decisions, each with a price on it.
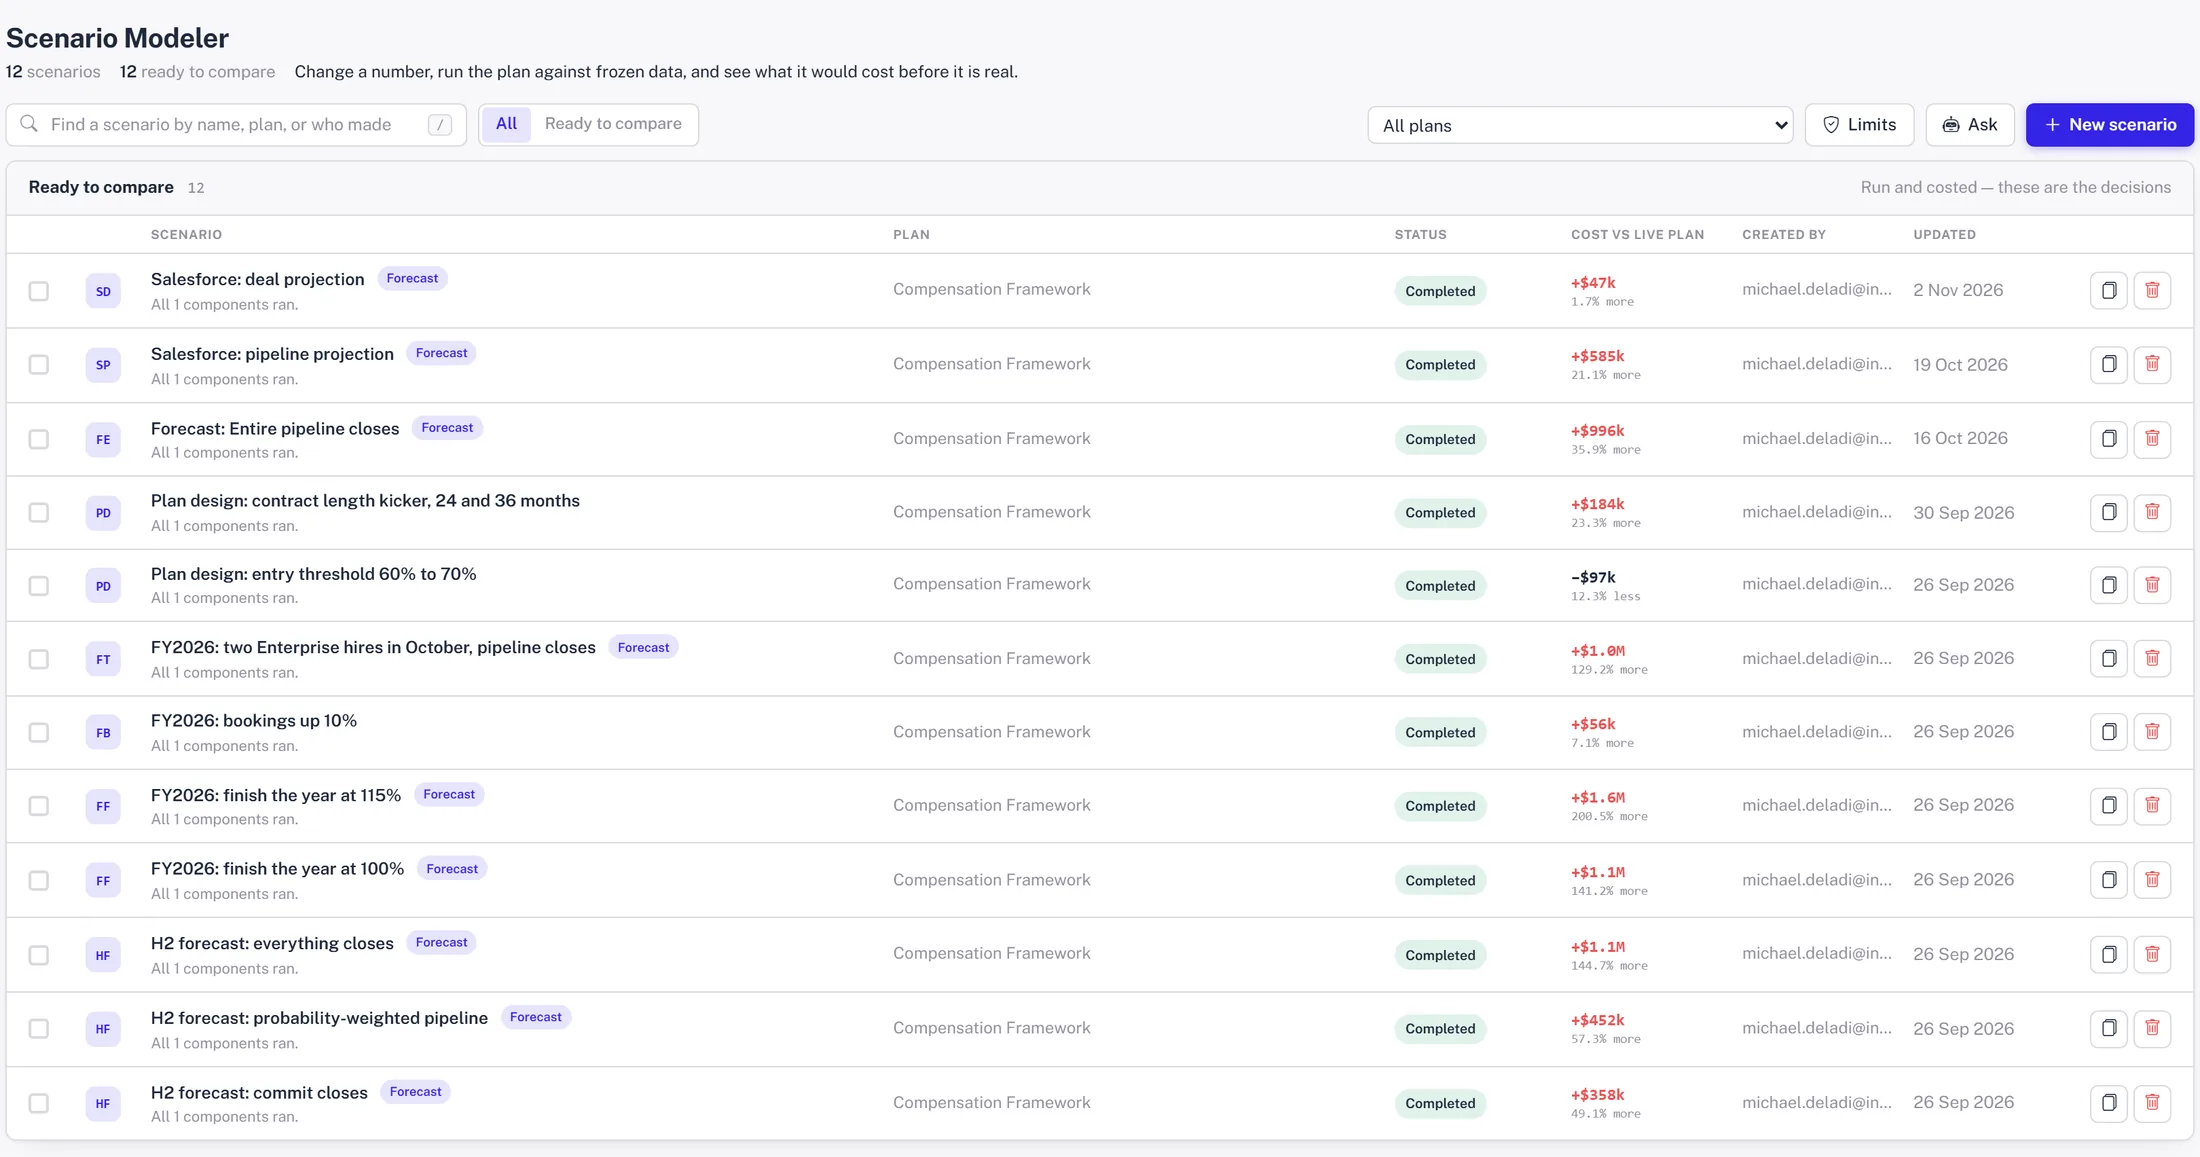
Every forecast and every design question is a scenario on the list, costed against the live plan. Limits warn when an option costs too much or cuts any one rep too deeply. The ones that were never promoted are still there, with their numbers.
- ✓ Compare any set side by side
- ✓ Ask the assistant about any of them
- ✓ Undo a promotion if the numbers do not hold
Bring the change you are arguing about.
Thirty minutes, your plan, your data. We will model it live and show you who it lands on.
Book a demo