1.Why rate times bookings is wrong
The spreadsheet forecast multiplies expected bookings by a blended commission rate. It is wrong in a predictable direction. Comp plans are convex: accelerators mean a rep who finishes at 130 percent costs far more than 1.3 times a rep at 100. A quarter that lands above plan costs more than the blended rate says, and a quarter below plan costs less than the fixed-cost view fears. Kickers, thresholds and tier moves make it worse.
The only forecast that respects the plan is one that runs the plan.
2.Every forecast is a scenario
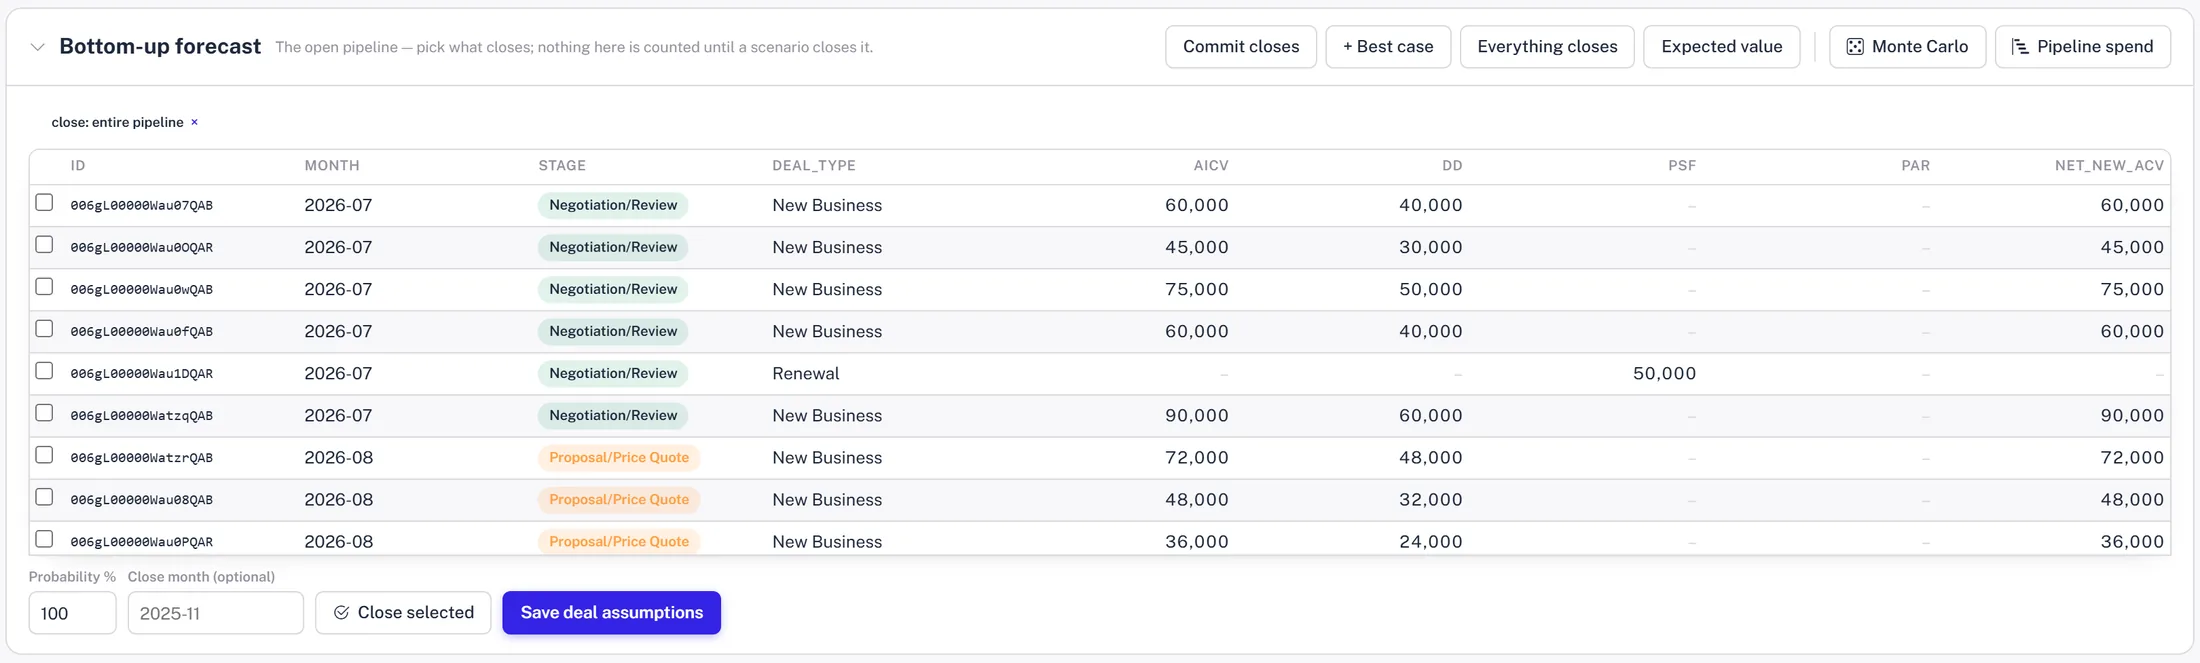
Start from the open pipeline as Salesforce has it: each deal with its amount, stage, forecast category and expected close month. A forecast is a set of assumptions about those deals: these close as written, those slip a month, these drop. The scenario forks the whole data set, applies the assumptions, and runs the same engine that pays the reps for the rest of the year.
Results come back as cost today against cost proposed, cost of sales, who the money lands on, and cost by component. Because it is a scenario, you can compare it with another, share it, or promote it into the budget.
3.The five one-click forecasts
- ✓Commit: only deals in the commit category close, in the month the rep says.
- ✓Best case: commit plus best case.
- ✓Everything closes: the ceiling. On the demo book the whole pipeline closing moves cost of sales from 23.9 to 26.2 percent.
- ✓Expected value: each deal weighted by its probability, which gives a mean but hides the spread.
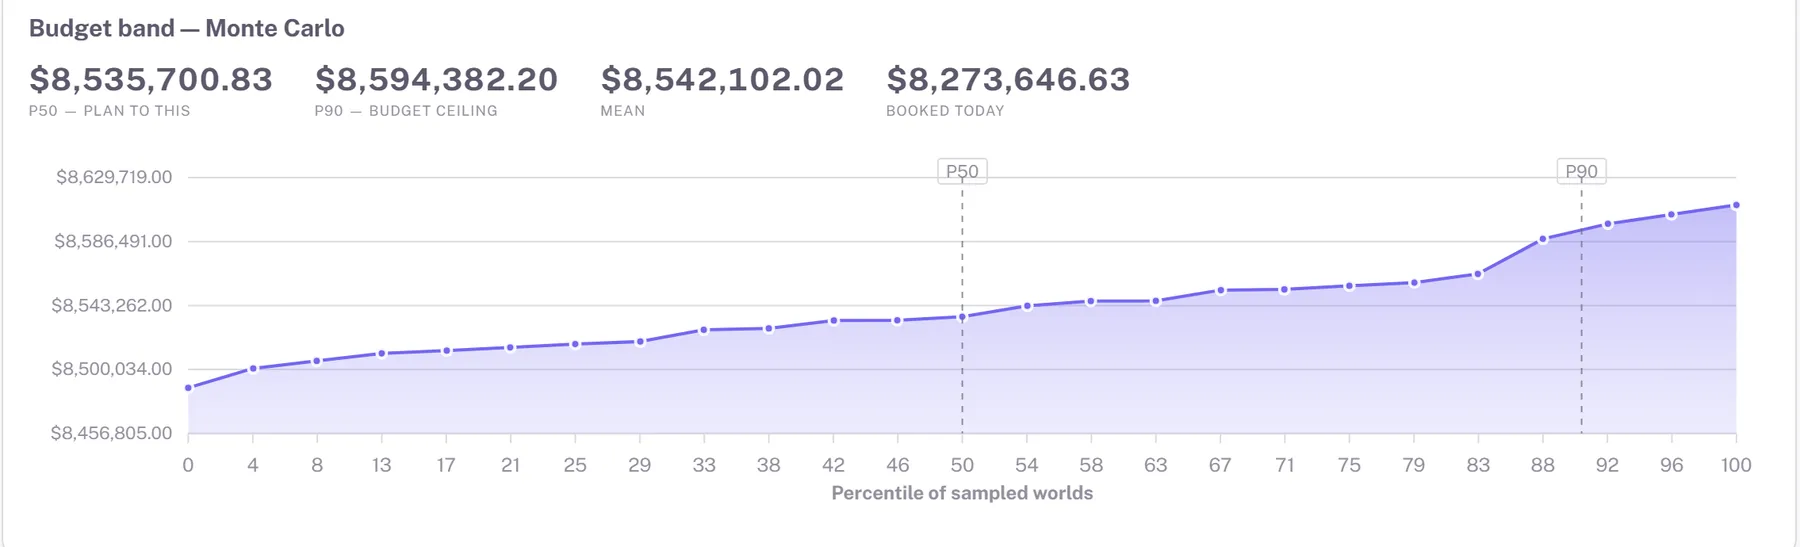
- ✓Monte Carlo: each deal closes or does not, at random, by its probability, a few thousand times. The output is a distribution, not a number.
4.P50 to plan to, P90 to budget for
The distribution is the point. The median, P50, is the number to plan to: half the time you will spend more, half less. The 90th percentile is the number to budget for: the quarter where almost everything lands and the accelerators all fire. The gap between them is your exposure, and it is usually wider than anyone expected, because convexity puts a long tail on the right.
Report both. A single-number forecast invites a single-number argument. A band invites a discussion about which deals drive the tail, which is the conversation finance and sales should be having.
5.Watch cost of sales, and get the denominator right
Commission dollars go up when the company sells more. That is good news dressed as a cost overrun. The ratio that tells you whether the plan is healthy is comp cost of sales: commission paid over booked revenue, per period.
Get the denominator from the deals, counted once each, in the period they booked. A deal credited to four payees across two components is still one deal. The demo book once reported a 0.89 percent cost of sales because the denominator counted every credit row; the true figure was about six percent. Also keep growth assumptions out of the denominator: a forecast that inflates revenue to flatter the ratio is not a forecast.
6.Make it monthly
Run the forecast at each pipeline review. Promote the one leadership agrees with as the working budget. When the month closes, the actual replaces the forecast in the same view, so the variance explains itself: these deals slipped, that one closed bigger, this rep crossed a tier.
Finance stops being surprised by commissions in the quarter they went well.